The Dynamic Nature of ACS
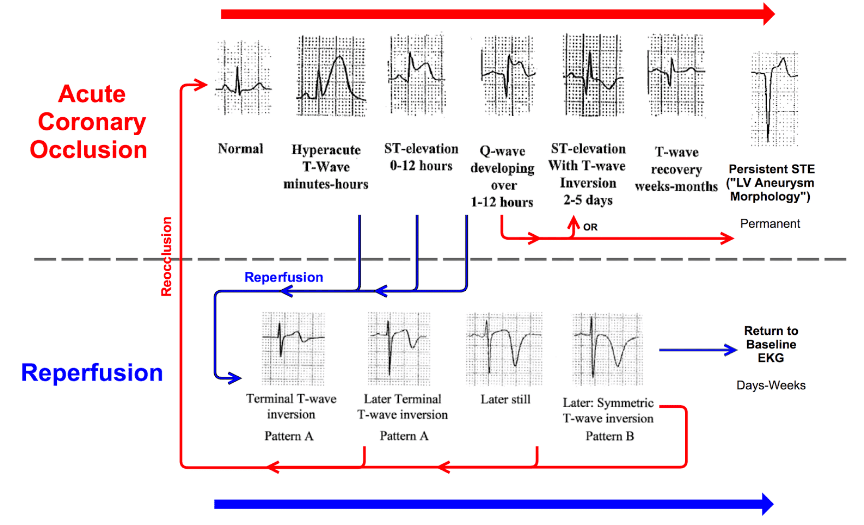
ECG Findings
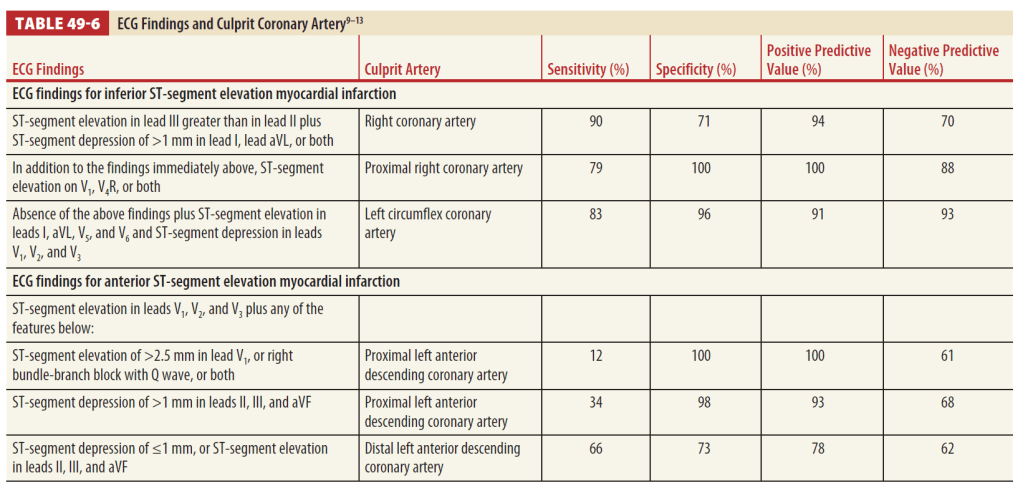
*LAD: >0.5 mm elevation in avR; possibly also >1mm STE in V1
*Elevation of avR>V1 suggests LAD occlusion
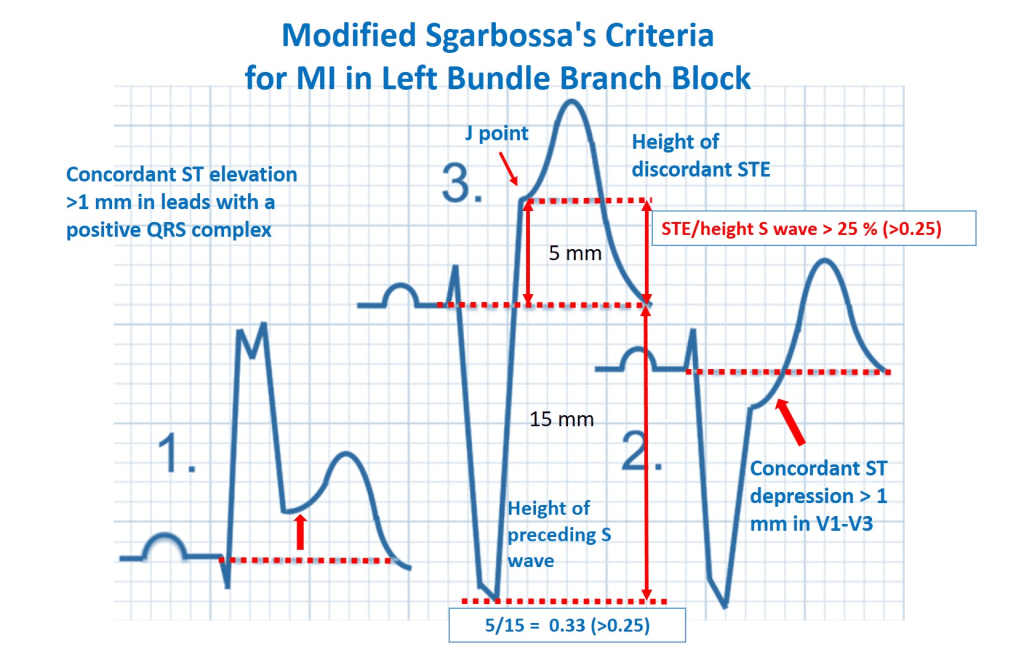
Identifying an Acute MI in LBBB
- STE ≥ 1mm and concordant with the QRS complex (OR, 25.2)
- STD ≥ 1mm in leads V1, V2, or V3 (OR, 6.0)
- STE ≥ 5mm and discordant with the QRS complex (Sgarbossa)
- STE ≥1mm AND has an amplitude at least 25% of the preceding S-wave (Modified Sgarbossa)
Identifying an Acute MI in Paced Rhythms
Pacing causes secondary repolarization changes of opposing polarity to that of the predominant QRS complex. Most leads have predominant negative QRS complexes followed by ST segment elevations and positive T waves.
- ST-segment elevations ≥ 5mm is most indicative of AMI in leads with predominantly negative QRS complexes
- Any ST-segment elevation concordant to the QRS complex in a predominantly positive QRS complex is highly specific for AMI
- ST-segment depressions in leads V1 to V3 with a predominantly negative QRS complex has an 80% specificity for AMI
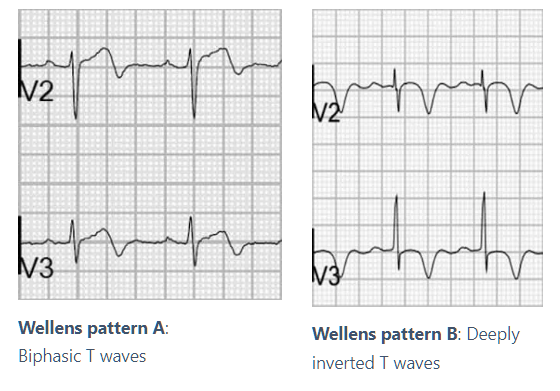
Wellen’s Syndrome
Associated with critical stenosis of the LAD; abnormal T-waves appear when the patient is pain free and may normalize when pain recurs
- Deeply inverted T-waves in leads V2 and V3 (75% of patients)
- Biphasic T-waves in leads V2 and V3 (25% of patients)
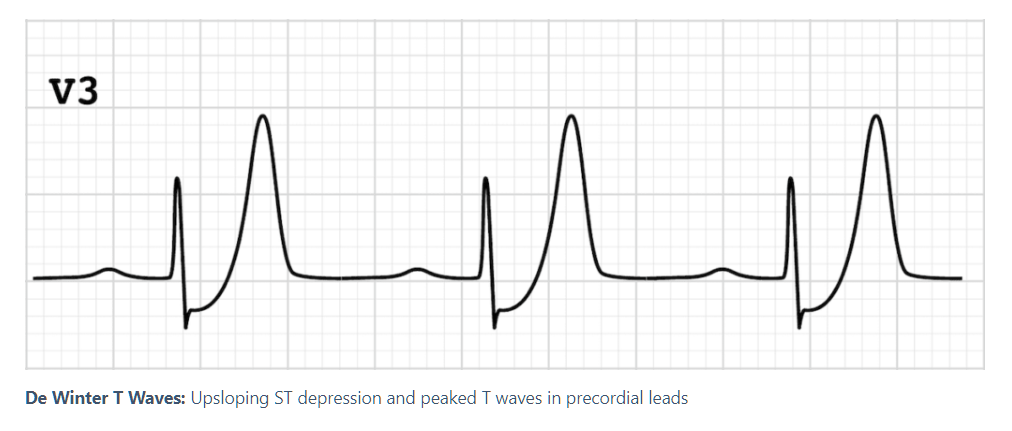
De Winter T-Waves
The de Winter pattern is seen in ~2% of acute LAD occlusions. Typical STEMI morphology may precede or follow the de Winter pattern
- Tall, prominent symmetrical T-waves in the precordial leads (V1-V6)
- Upsloping ST-segment depression >1mm at the J point in the precordial leads
- Absence of ST elevation in the precordial leads
- Reciprocal ST segment elevation (0.5-1mm) in aVR

Leave a comment